ColorThink 4
| Software Version | ColorThink Pro 4, ColorThink Pro 4 Measure Pack, ColorThink Pro 4 prePress Pack |
|---|---|
| Platform | MAC, Windows |
| Brand | Chromix, IDEAlliance |
Chromix ColorThink 4 – the Best now Better
Version 4 adds tons of features and thoroughly modernizes the industry’s best color graphing and analytics tool while retaining its familiar interface.
Measuring
Probably the biggest addition and longest awaited feature is direct instrument measuring within ColorThink 4. Compatible with most current mainstream measuring instruments, ColorThink 4 senses a connected instrument automatically, adding it to the icon bar. If you start measuring directly from the icon bar, the results are dropped into a new worksheet. If you start measuring in the Grapher, the results are dropped right into the graph. Easy enough?. Full details here
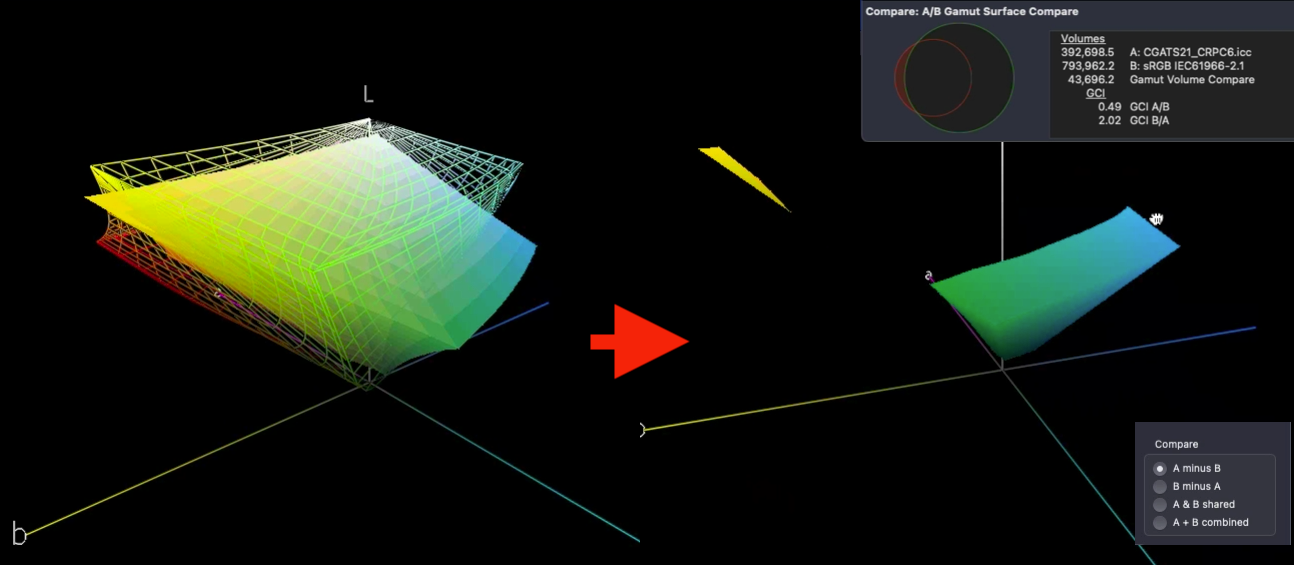
Gamut Comparison
Also highly anticipated is the ability to analyze and compare two gamuts. ColorThink 4 uses gamut subtraction and/or addition to create an entirely new kind of graph. For example: When sRGB and a press profile are compared, ColorThink 4 subtracts the portion of the press profile that is left outside of sRGB. This is a very clear illustration of the colors on press that are unavailable if sRGB is your working space. The compare function can reverse the subtraction, so the press profile is subtracted from the sRGB gamut. You can also select the shared gamut to be shown in addition to the fully combined gamut. The Plot Item inspector shows the gamut volumes of each of the two original gamuts as well as the comparison volume. The gamut comparison index or GCI is also an easy number to relate to and is calculated in accordance to the ISO standard.
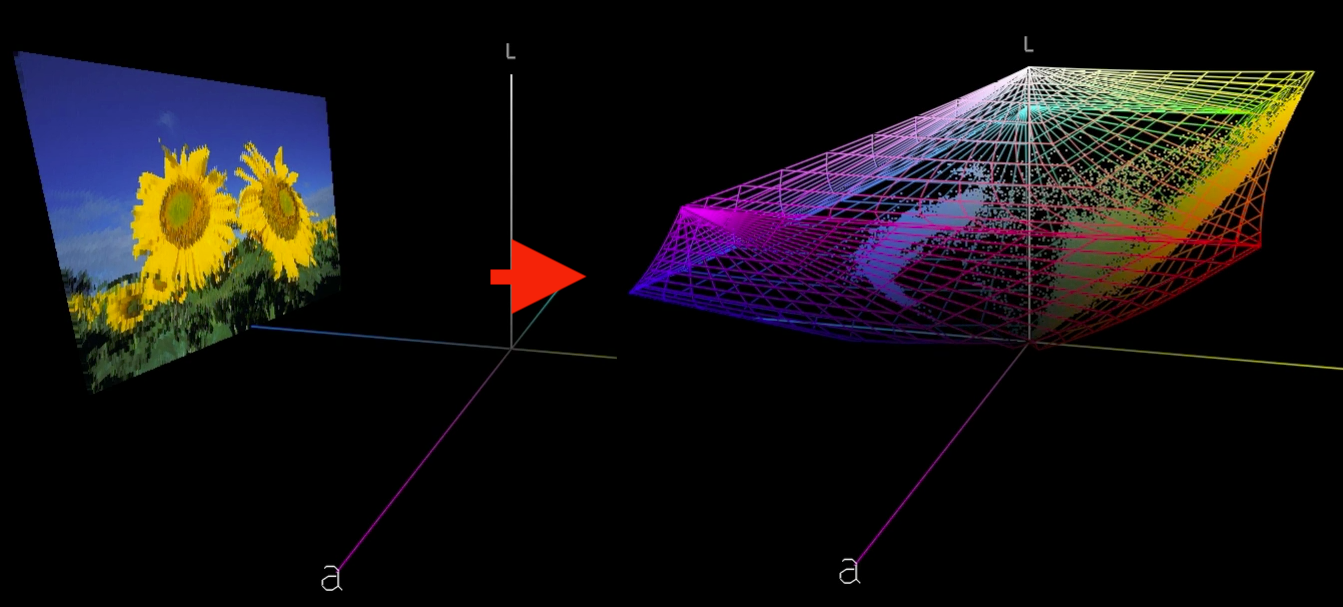
Image Animation
ColorThink 4 has an exciting new way of displaying images in the grapher. Images load in their normal form and smoothly animate between the normal display form and the Lab values of the image colors in the grapher. The embedded profile is easily selected to show in wireframe form, illustrating how the image colors all fit within the gamut of its embedded profile. This feature alone will wow your audience and help get their head into color faster than any previous visualization!
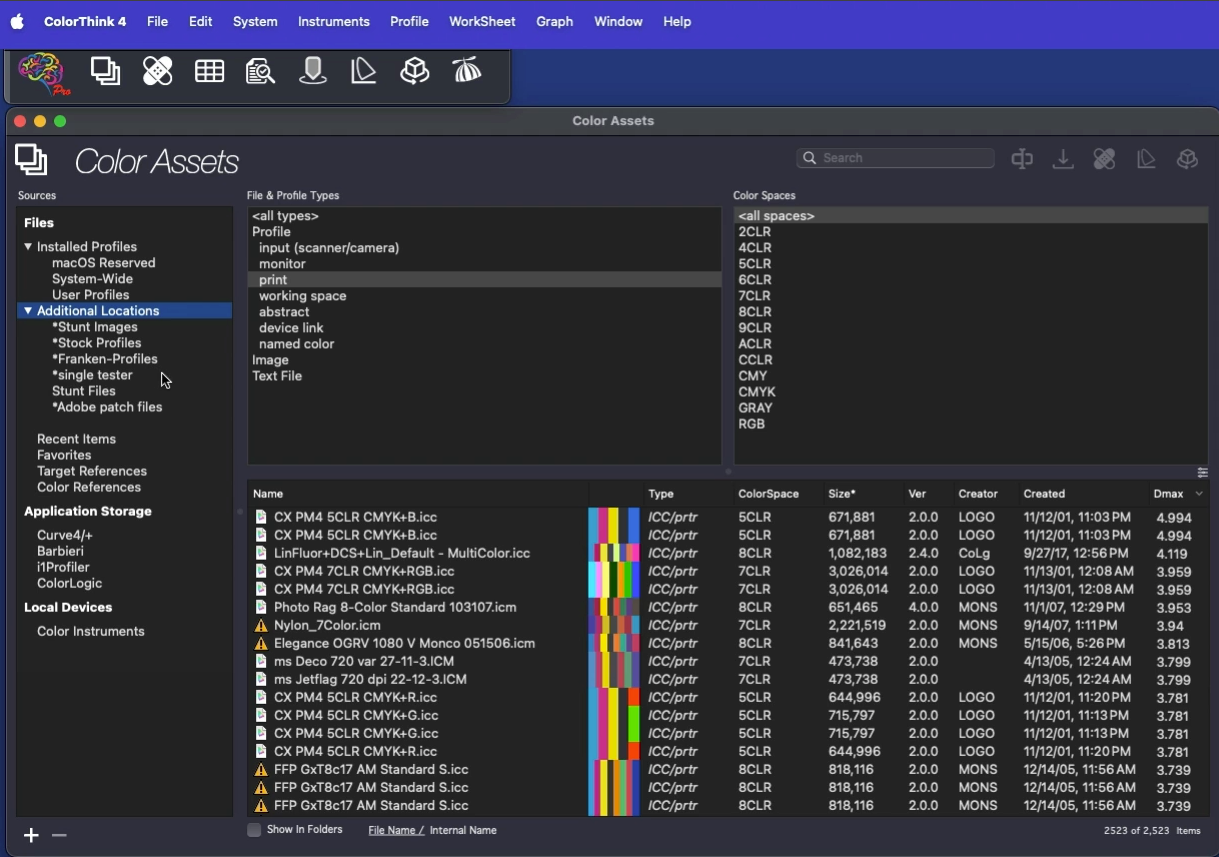
Color Assets
This is a huge benefit for many color folks that have a zillion profiles and related files in various places. ColorThink 4 organizes all Color Assets, including profiles that are installed in your system plus other assets that are located wherever you store them.
Filter them by the kind of asset, the color space of the asset or even arbitrary text.
ColorThink harvests tons of meta-data about each asset type, including primary colors, asset type, color space, gamut volume and various size parameters and even the max density value Dmax. Then you can sort by these values to find the largest gamut profile or the paper with the lowest Dmax. There is so much power in the organizational benefits of the new Color Assets that you’ll just have to see for yourself. This feature will save literally hours of search time.
White Point Editor
(available with PrePress Pack license level)
One new tool in ColorThink 4 is the White Point Editor. Modifying the white point in an ICC profile is a handy way to alter the appearance of proofs as well as other functions. The new White Point Editor is very flexible, where you can enter XYZ, Lab or correlated color temperature values. You can also drag and drop a list of colors or another ICC profile into the editor and the white point of those will be used to modify the original profile’s white point. It’s a simple click and direct measurement from your color instrument to sample a real world paper color and change your profile’s white point to that color. Very powerful.
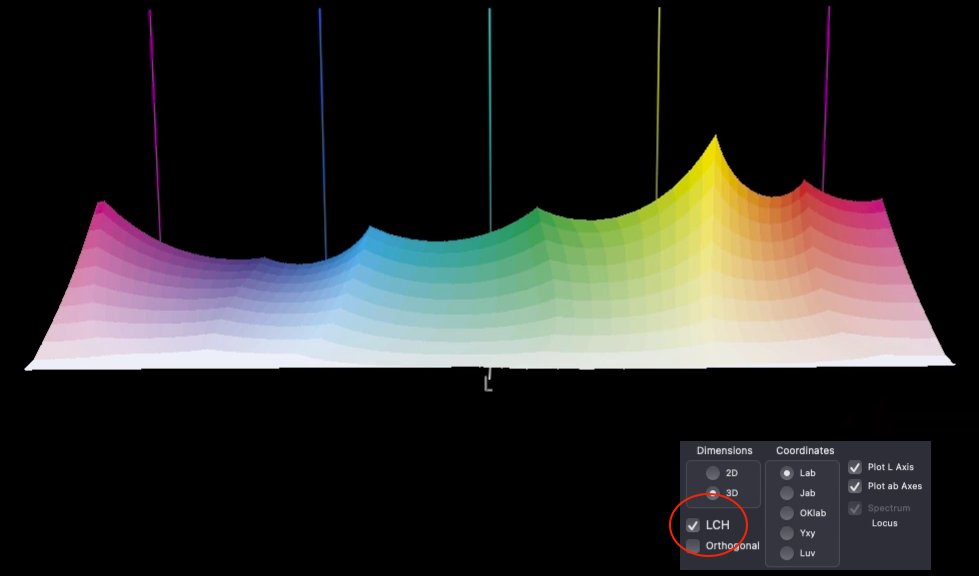
LCH Mode
Another effective coordinate space which unfolds profiles and other data sets is LCH. Color hue, which normally goes around the color wheel like hands of a clock is stretched out into a straight line. ColorThink 4 graphs in LCH allowing you to evaluate your color from a very different perspective. With this view the relative saturation or chroma of each of the colors is now easily compared because they’re viewed across a straight line. Alternate color spaces like Jab and OKLab can also be used in this mode so you can see how they affect the saturation to become a lot more regular.
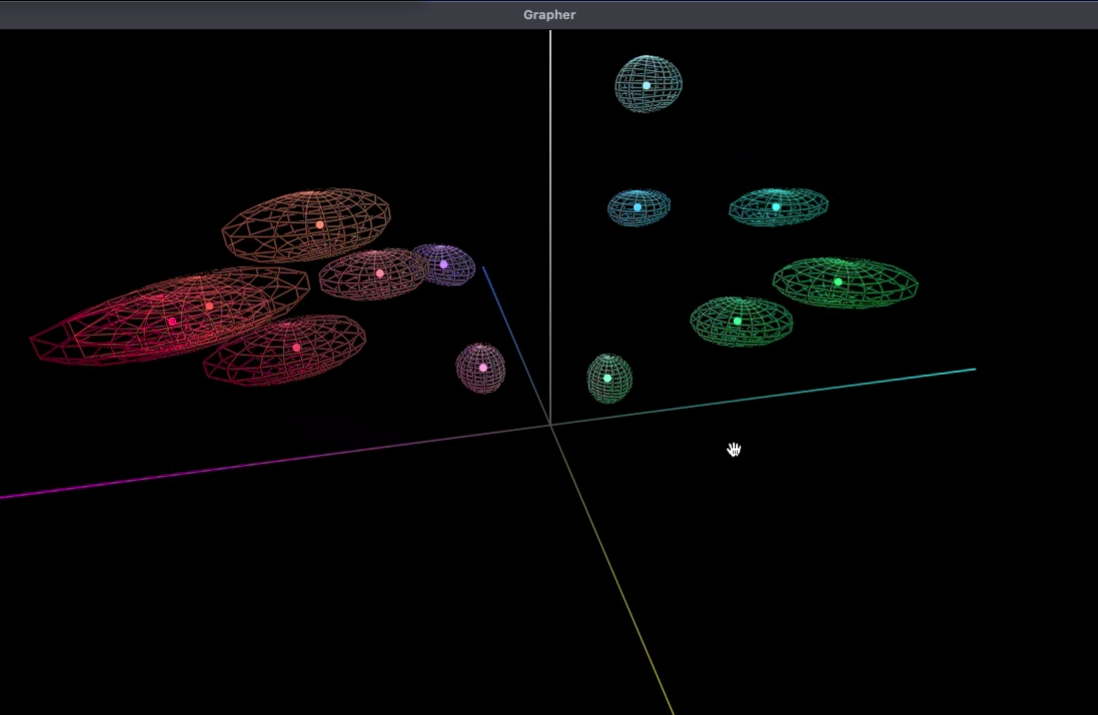
Delta-E blobs
The color difference calculations we know as delta E can be difficult to explain. ColorThink 4 can illustrate the idea of Delta E as a blobs or spheres around colors. The Delta E 76 and Delta E 2000 have very different perspectives and shapes relating to closeness distance of color aims. ColorThink 4 will help with this understanding. You can change the plotting coordinates from Lab to Jab or other modes to see how it affects these color differencing shapes.
Related products
$39.95
Price range: $235.00 through $2,910.00
Price range: $95.00 through $1,590.00
Price range: $1,900.00 through $8,125.00